GDELT + Stock Data: Sentiment Score Backtesting
We've got our data, but its showing no correlation between variables we thought were correlated. I want to backtest it before completely giving up on this strategy. I'm gonna use the backtesting.py package in python to do this. Its pretty simple to use but has some limitations if we ever wanted to try more complex strategies. Using the following strategy:
from collections import Counter
from backtesting import Strategy, Backtest
from gdeltdoc import GdeltDoc, Filters
import pandas as pd
import matplotlib.pyplot as plt
import yfinance as yf
import numpy as np
from scipy.stats import pearsonr

START_DATE = "2017-01-01"
END_DATE = "2024-12-30"
TICKER = "SPY"
SEARCH_TERM = "economy"

# Set up GDELT filters
f = Filters(
    keyword=SEARCH_TERM,
    start_date=START_DATE,
    end_date=END_DATE
)

gd = GdeltDoc()
articles = gd.article_search(f)
timeline = gd.timeline_search("timelinetone", f)
timeline

def get_tone(df):
  tones = [0 for i in range(df.shape[0])]
  timeline["datetime_clean"] = timeline.datetime.dt.date
  for index, date in enumerate(df.index):
    if date.date() in list(timeline.datetime.dt.date):
      tones[index] = float(timeline[timeline.datetime_clean == date.date()]["Average Tone"])
    else:
      tones[index] = 0
  return pd.Series(tones)

GOOG_Updated = yf.download(TICKER, start=START_DATE, end=END_DATE, multi_level_index=False)

class SentimentGDELT(Strategy):
    buy_threshold = 0.5
    close_threshold = -0.5

    def init(self):
        self.tone = self.I(get_tone, self.data.df)

    def next(self):
        if self.tone != 0:
          if self.tone < self.buy_threshold:
            self.buy()
          elif self.tone > self.close_threshold:
            self.position.close()

bt = Backtest(GOOG_Updated, SentimentGDELT, cash=10_000, commission=.002)
stats = bt.run()
bt.plot()
stats
Which gave us the following plot:
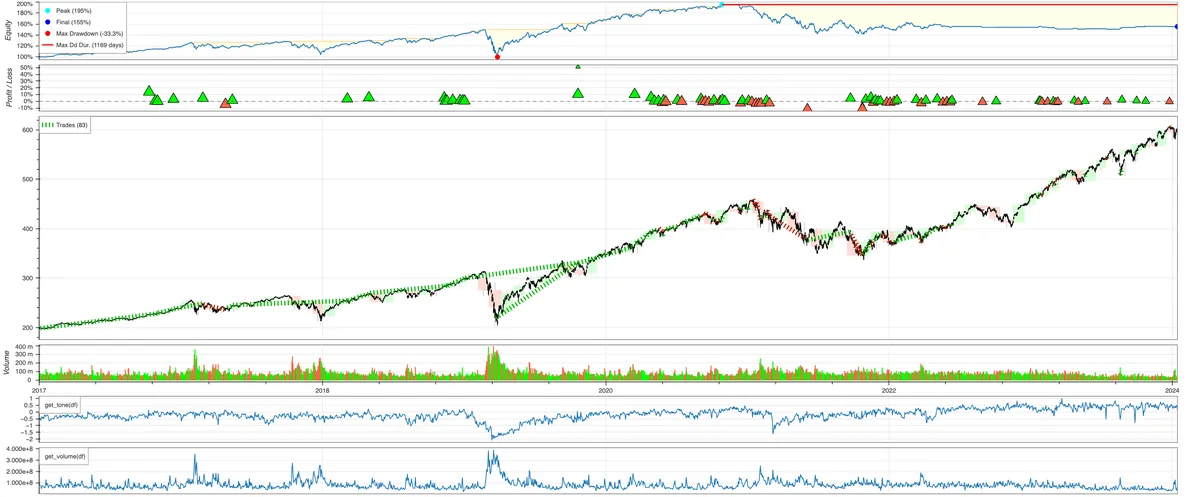
Not too bad... at first sight. Looking at the statistics tells another story.
Start                     2017-01-03 00:00:00
End                       2024-12-27 00:00:00
Duration                   2915 days 00:00:00
Exposure Time [%]                   87.661692
Equity Final [$]                 20945.559185
Equity Peak [$]                  22627.686388
Return [%]                         109.455592
Buy & Hold Return [%]              201.593354
Return (Ann.) [%]                    9.712549
Volatility (Ann.) [%]               19.511283
Sharpe Ratio                         0.497791
Sortino Ratio                        0.762928
Calmar Ratio                         0.289356
Max. Drawdown [%]                  -33.566098
Avg. Drawdown [%]                   -1.684377
Max. Drawdown Duration     1137 days 00:00:00
Avg. Drawdown Duration       25 days 00:00:00
# Trades                                   64
Win Rate [%]                           53.125
Best Trade [%]                      119.20113
Worst Trade [%]                    -16.862316
Avg. Trade [%]                        1.12551
Max. Trade Duration        1756 days 00:00:00
Avg. Trade Duration          43 days 00:00:00
Profit Factor                        3.550265
Expectancy [%]                       1.791041
SQN                                  0.877532
_strategy                      SentimentGDELT
_equity_curve                             ...
_trades                       Size  EntryB...
dtype: object
A common trend in my analysis is that I have yet to devise a strategy that outperforms the market itself. You can see that in the "Buy and Hold Return [%]" which shows the return you would of got if you just held on to the stock during the period being backtested.
Alas, back to the drawing board.